A technical indicator used to measure the current price level relative to an average price level over a given period of time is called Commodity Channel Index (CCI).
Donald Lambert developed it and originally designed to identify cyclical turns in commodities.
The CCI is categorized as a momentum oscillator, which means
that CCI is used to identify overbought and oversold levels.
The basic output of the CCI indicator is that commodities move in cycles, with highs and lows coming at periodic intervals.
The CCI indicates when one of those cyclical
reversals is imminent.
As Lambert originally used CCI to trade commodities, the indicator is used across different assets nowadays.
How Commodity Channel Index (CCI) Works
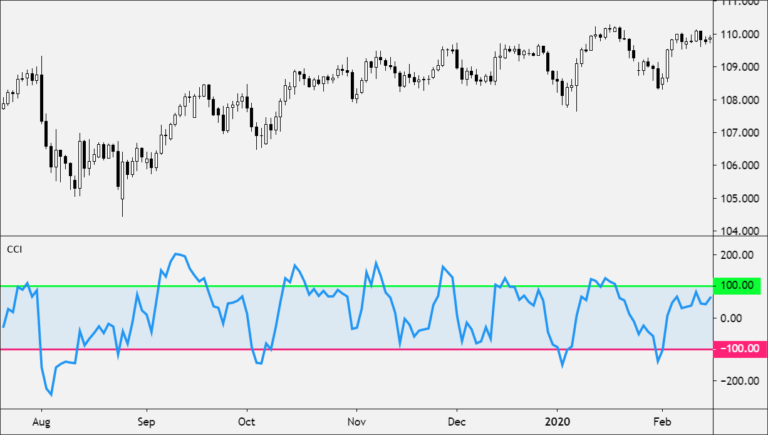
The Commodity Channel Index (CCI) is used to measure the current price level relative to an average price level over a given period of time.
The CCI fluctuates above and below zero.
-
CCI is relatively high when prices are far above their average.
-
CCI is relatively low when prices are far below their average.
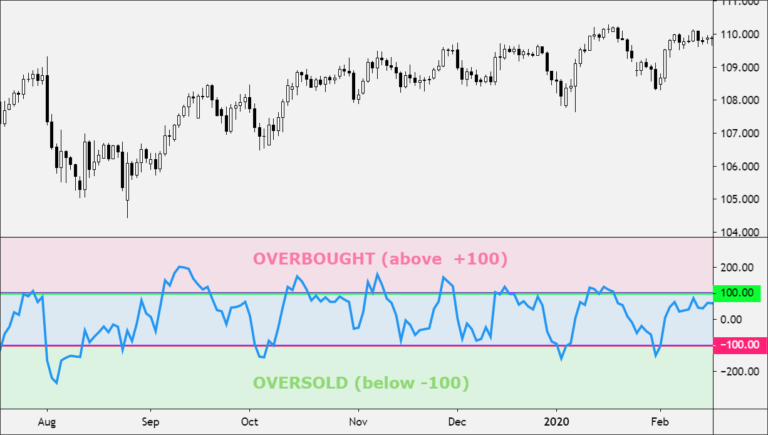
CCI helps in identifying the levels of oversold and overbought commodities by using this method.
The CCI values percentage that fall between +100 and -100 will depend on the number of periods used.
-
A shorter CCI will be more volatile with a smaller percentage of values between +100 and -100.
-
The more periods used to calculate the CCI, the higher the percentage of values between +100 and -100.
Lambert's trade guidelines for CCI focus on moving above +100 and below -100 to generate buy and sell signals.
Since approximately 70 to 80 percent of CCI values are between +100 and -100, the buy and sell signal will generate only 20 to 30 percent
of the time.
Buy Signal
-
When the CCI moves above +100, price is considered to be entering into a strong uptrend and a buy signal is given.
-
The position should be closed when the CCI moves back below +100.
Sell Signal
-
When the CCI moves below -100, price is considered to be in a strong downtrend and a sell signal is given.
-
The position should be closed when the CCI moves back above -100.
How to Use the Commodity Channel Index (CCI)
The CCI is a versatile indicator and can be used in different ways.
Overbought and Oversold Levels
CCI is used to identify overbought and oversold levels.
-
An asset is considered oversold when the CCI falls below -100.
-
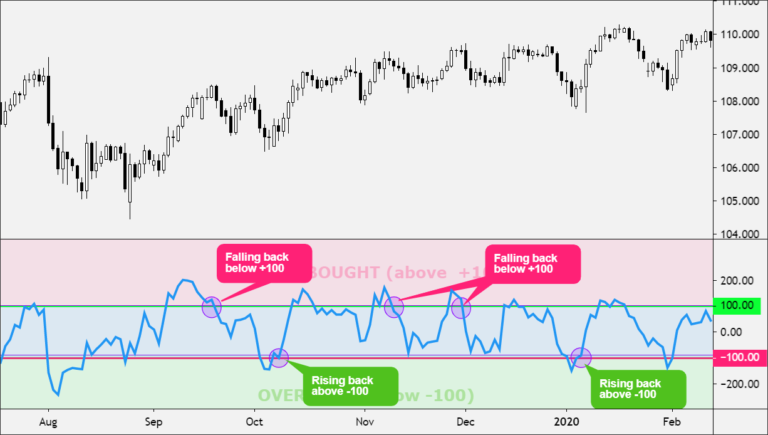
From oversold levels, a buy signal might be given when the CCI moves back above -100.
-
An asset is considered overbought when the CCI rises above +100.
-
From overbought levels, a sell signal might be given when the CCI moved back below +100.
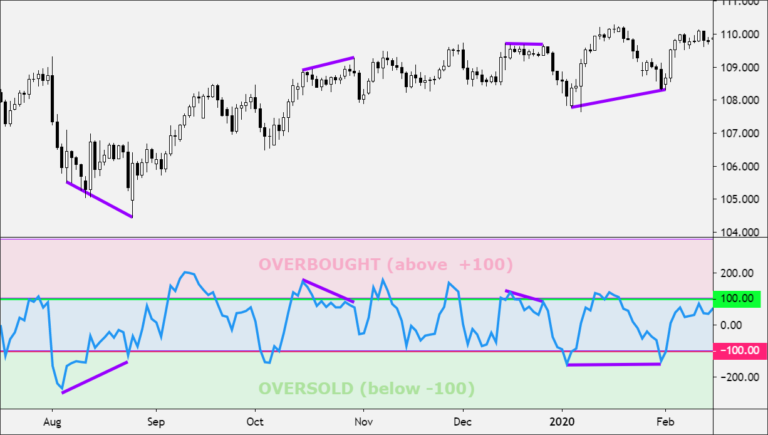
CCI Divergence
Like most indicators, for decreasing the signals strength the divergence between the actual price and the indicators can also be applied.
-
A positive divergence below -100 would increase the strength of a signal based on a move back above -100.
-
A negative divergence above +100 would increase the strength of a signal based on a move back below +100.
CCI Trend Line Breaks
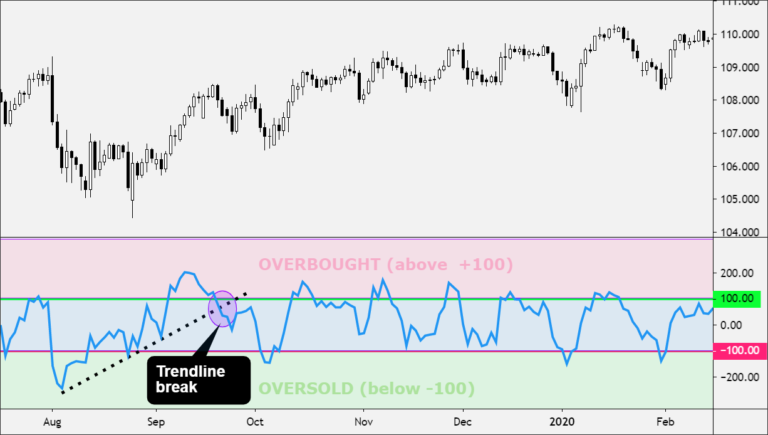
The signal can be generated by using Trend line breaks. To draw the Trend lines peaks and troughs can be connected
-
From oversold levels, an advance above -100 and trend line breakout is considered bullish.
-
From overbought levels, a decline below +100 and a trend line break is considered bearish.
CCI is used by traders for the identification of price reversals, price extremes, and trend strength.
The CCI should be used in conjunction with other forms of technical analysis like other technical indicators.
How to Calculate the Commodity Channel Index (CCI)
To calculate the CCI properly many steps are required.
The steps for calculation of CCI are given below with a proper sequence.
First of all the formula of the price is must be calculated, using the high, low, and close for the interval. It
is the simple arithmetic average of the three values.
The formula is:
-
TP represents the typical price.
-
High is the highest price for this interval.
-
Low is the lowest price for this interval.
-
Close is the closing price for this interval.
Next, you calculate a simple moving average of the typical price for the number of periods specified.
-
TPAVG is the moving average of the typical price.
-
TP is the typical price for the nth interval.
-
n is the number of intervals for the average.
-
The next step is rather complex; it computes the mean deviation. The formula is:
-
MD is the mean deviation for this interval.
-
TPn is the typical price for the nth interval.
-
TPAVGn is the moving average of the typical price for the nth interval.
-
n is the number of intervals.
The symbol | | designates absolute value. In mathematical terms, negative differences are treated as positive values.
Now, the computation for the final CCI value is:
-
CCI is the Commodity Channel Index for the current period.
-
TPt is the typical price for the current period.
-
TPAVGt is the moving average of the typical price.
-
.015 is a constant.
-
MDT is the mean deviation for this period.
Lambert set the constant at .015 to ensure that approximately 70 to 80 percent of CCI values would fall between -100 and +100 for scaling purpose.
A
Abandoned Baby | Account Statement Report | Account Value | Accumulation Area | Accumulative Swing Index ASI | Address | ADDY | ADP National Employment Report | Advance Or Decline Index | Afghanistan Afghanis | Agency Model | Aggressor | Alan Bollard | Alan Greenspan | Albania Leke | Algerian Algeria Dinars | Alligator | Altcoin | Analysts | Andrews Pitchfork | Angela Merkel | Angola Kwanza | Anti Money Laundering AML | ANZ Commodity Price Index | Application Programming Interface API | Appreciation | Arbitrage | Argentina Pesos | Armenian Drams | Aroon Oscillator | Aroon Up And Down | Aruban Guilder | Ascending Channel | Ascending Trend Line | Ascending Triangle | ASIC Mining | Asset | Asset Purchase Programme APP | Asset Purchases | Asymmetric Encryption | Asymmetric Slippage
B
Bag | Bag Holder | Bahmas Dollars | Bahrain Dinars | Bail In | Bail Out | Balance Of Trade | Baltic Dry Index | Bangladesh Taka | Bank Levy | Bank Of Canada BOC | Bank Of England BOE | Bank Of International Settlement BIS | Bank Of Japan BoJ | Bank Run | Bank Run | Banking Institutions | Bar Chart | Barbados Dollars | Base Currency | Base Rate | Basing | Basing Point | Bear | Bear Flag | Bear Market | Bear Trap | Bearish | Binary Options | Bitcoin Cash | Bitcoin Maximalist | Bitcoin Or BTC | Block | Block Explorer | Block Header | Block Height | Block Reward | Blockchain | Blue Chip | Bolivia Bolivianos | Bollinger Bands | Bond | Bond Auction | Bond Yeild | Book | Boris Schlossberg | Botswana Pulas | Brazilian Brazil Real | Breakdown | Breakeven | Breakout | Brent Crude | Bretton Woods Agreement Of 1944 | BRIC | Broadening Formation | Broker | BTD | BTFD | Bucket Shop | Bulgarian Leva | Bull | Bull Flag | Bull Market | Bull Trap | Bullish | Bullish Engulfing Pattern | Bundesbank | Burundi Francs | Business Inventories | Buy Side | Buying Pressure
C
Cable | Camarilla Pivot Points | Cambist | Cambodian Riels | Canadian Dollar | Cape Verde Escudos | Carbon Credits | Cardano ADA | Carry Trade | Cash Market | Catalyst | Cayman Islands Dollars | Cboe Eurocurrency Volatility Index | Central Bank | Central Bank Digital Currency | Central Bank Intervention | Central Counterparty Clearing Houses CCPs | Central Limit Order Book Or CLOB | Chaikin Oscillator | Chart Pattern | Chartist | Chicago PMI | Chilean Peso | Chinese Renminbi | Chinese Yuan | Christine Lagarde | Circulating Supply | Cleared Funds | Clearing | Clearing Price | Client | Closed Position | Cloud Mining | Coin Age | Cold Storage | Collateral | Colombian Pesos | Comdoll | Commercial Corporations | Commission | Commitments Of Traders Report Or COT | Commodity | Commodity Channel Index Or CCI | Commodity Futures Trading Commission CFTC | Commodity Research Bureau Index | Commodity Trading Advisor CTA | Communaute Financiere Africaine Francs | Comoros Francs | Completeness | Compound COPM | Comptoirs Francais Du Pacifique Francs | Conference Board Consumer Confidence Index CCI | Confirmation | Confluence | Congo Congolese Francs | Consensus Algorithm | Consolidation | Consumer Price Index CPI
ForexTrading.pk