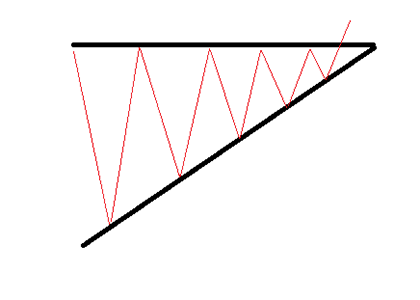
A chart pattern drawn by a series of higher lows and upper resistance level is called an ascending triangle.
The following two lines represent the ascending triangle:
A horizontal resistance line running through peaks.
An uptrend line is drawn through the bottoms.
For the identification of same trendline two bottoms will be sufficient otherwise in case of having more bottoms it will be more favorable.
If price raises, a resistance occurs in it and profits may start reducing.
The later decrease in price is less as compared to previous decrease and it shows the series of higher lows.
The top line will occur straight whereas the bottom line will go upper at an angle, if a line is drawn above and below the pattern.

The price becomes stable and moves towards the upper trend in higher lows as it shows that market is receiving more buyers gradually and as a result the pressure of buying increases.
Prices are stabilizing with increasing bias, so traders should keep an eye on breakouts coming through resistance levels.
It will be a support level of price if price can break through a resistance level.
Breakout can be based on technical analysis and / or due to the flow of news, so it's important to consider the basics and market sentiment when using this pattern.
Must consider the fakeouts (false breakouts), they might be easily confused with the true ones when, in fact, the price is going to retreat back into the triangle.
An ascending triangle is classified as a continuation chart pattern.
Continuation of an existing trend may be reason for the continuity of patterns.
Continuation patterns also comprise of symmetrical triangles, descending triangle, wedges, flags, rectangles, and pennants.
The possibility of exceptions is more as an ascending triangle is a bullish continuation pattern. It not frequently considers the development of downtrend situations.
The ascending triangle is expected to behave like a reversal pattern, if appears in the downtrend.
Breakouts can also happen in both directions. Statistically, upward breakouts are more likely to occur, but downward ones seem to be more reliable.
The majority of breakouts of either direction are observed in the second half of the pattern formation distance.
A
Abandoned Baby | Account Statement Report | Account Value | Accumulation Area | Accumulative Swing Index ASI | Address | ADDY | ADP National Employment Report | Advance Or Decline Index | Afghanistan Afghanis | Agency Model | Aggressor | Alan Bollard | Alan Greenspan | Albania Leke | Algerian Algeria Dinars | Alligator | Altcoin | Analysts | Andrews Pitchfork | Angela Merkel | Angola Kwanza | Anti Money Laundering AML | ANZ Commodity Price Index | Application Programming Interface API | Appreciation | Arbitrage | Argentina Pesos | Armenian Drams | Aroon Oscillator | Aroon Up And Down | Aruban Guilder | Ascending Channel | Ascending Trend Line | Ascending Triangle | ASIC Mining | Asset | Asset Purchase Programme APP | Asset Purchases | Asymmetric Encryption | Asymmetric Slippage
B
Bag | Bag Holder | Bahmas Dollars | Bahrain Dinars | Bail In | Bail Out | Balance Of Trade | Baltic Dry Index | Bangladesh Taka | Bank Levy | Bank Of Canada BOC | Bank Of England BOE | Bank Of International Settlement BIS | Bank Of Japan BoJ | Bank Run | Bank Run | Banking Institutions | Bar Chart | Barbados Dollars | Base Currency | Base Rate | Basing | Basing Point | Bear | Bear Flag | Bear Market | Bear Trap | Bearish | Binary Options | Bitcoin Cash | Bitcoin Maximalist | Bitcoin Or BTC | Block | Block Explorer | Block Header | Block Height | Block Reward | Blockchain | Blue Chip | Bolivia Bolivianos | Bollinger Bands | Bond | Bond Auction | Bond Yeild | Book | Boris Schlossberg | Botswana Pulas | Brazilian Brazil Real | Breakdown | Breakeven | Breakout | Brent Crude | Bretton Woods Agreement Of 1944 | BRIC | Broadening Formation | Broker | BTD | BTFD | Bucket Shop | Bulgarian Leva | Bull | Bull Flag | Bull Market | Bull Trap | Bullish | Bullish Engulfing Pattern | Bundesbank | Burundi Francs | Business Inventories | Buy Side | Buying Pressure
C
Cable | Camarilla Pivot Points | Cambist | Cambodian Riels | Canadian Dollar | Cape Verde Escudos | Carbon Credits | Cardano ADA | Carry Trade | Cash Market | Catalyst | Cayman Islands Dollars | Cboe Eurocurrency Volatility Index | Central Bank | Central Bank Digital Currency | Central Bank Intervention | Central Counterparty Clearing Houses CCPs | Central Limit Order Book Or CLOB | Chaikin Oscillator | Chart Pattern | Chartist | Chicago PMI | Chilean Peso | Chinese Renminbi | Chinese Yuan | Christine Lagarde | Circulating Supply | Cleared Funds | Clearing | Clearing Price | Client | Closed Position | Cloud Mining | Coin Age | Cold Storage | Collateral | Colombian Pesos | Comdoll | Commercial Corporations | Commission | Commitments Of Traders Report Or COT | Commodity | Commodity Channel Index Or CCI | Commodity Futures Trading Commission CFTC | Commodity Research Bureau Index | Commodity Trading Advisor CTA | Communaute Financiere Africaine Francs | Comoros Francs | Completeness | Compound COPM | Comptoirs Francais Du Pacifique Francs | Conference Board Consumer Confidence Index CCI | Confirmation | Confluence | Congo Congolese Francs | Consensus Algorithm | Consolidation | Consumer Price Index CPI
ForexTrading.pk